Iceland Volcano: Svartsengi Uplift Slows
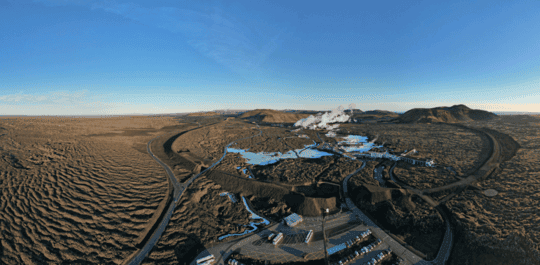 Protective barriers surrounding the Svartsengi area in early November 2024. (Photo: The Icelandic Met Office / Bjarki Kaldalóns Friis)
Update 18 June 2025
Continued uplift in Svartsengi, although it has slowed down.
If magma accumulation continues, the likelihood of an eruption increases as autumn approaches.
Seismic activity remains steady, averaging 10 minor earthquakes per day.
Roughly half of the magma volume in the chamber has reaccumulated since the start of the last eruption.
The hazard assessment has been updated with minor changes and is valid until July 15, 2025.
Ground Deformation (GPS Data)
GPS deformation data indicates ongoing uplift in Svartsengi, although the rate has decreased in recent weeks. Scientists at the Icelandic Meteorological Office believe the chances of a magma intrusion or eruption will increase in autumn if the magma accumulation persists. A comparable volume of magma to previous events is believed to be needed.
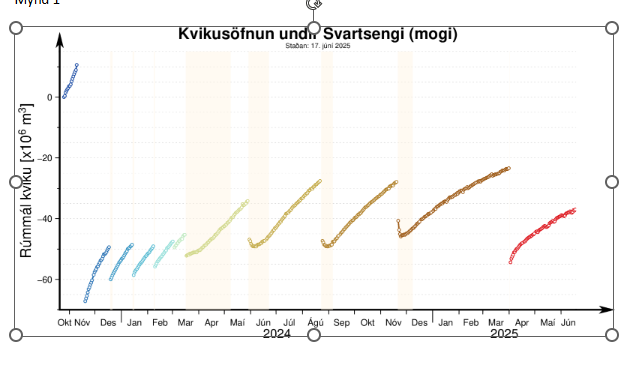
Image 1: Magma Accumulation under Svartsengi from October 2023 to June 2025
Magma Accumulation under Svartsengi from October 2023 to June 2025
The image shows the development of the estimated magma volume in the crust at Svartsengi. Each color represents a period between magma intrusions/eruptions. Magma accumulation is relatively steady week to week, but over longer periods, the inflow rate gradually decreases.
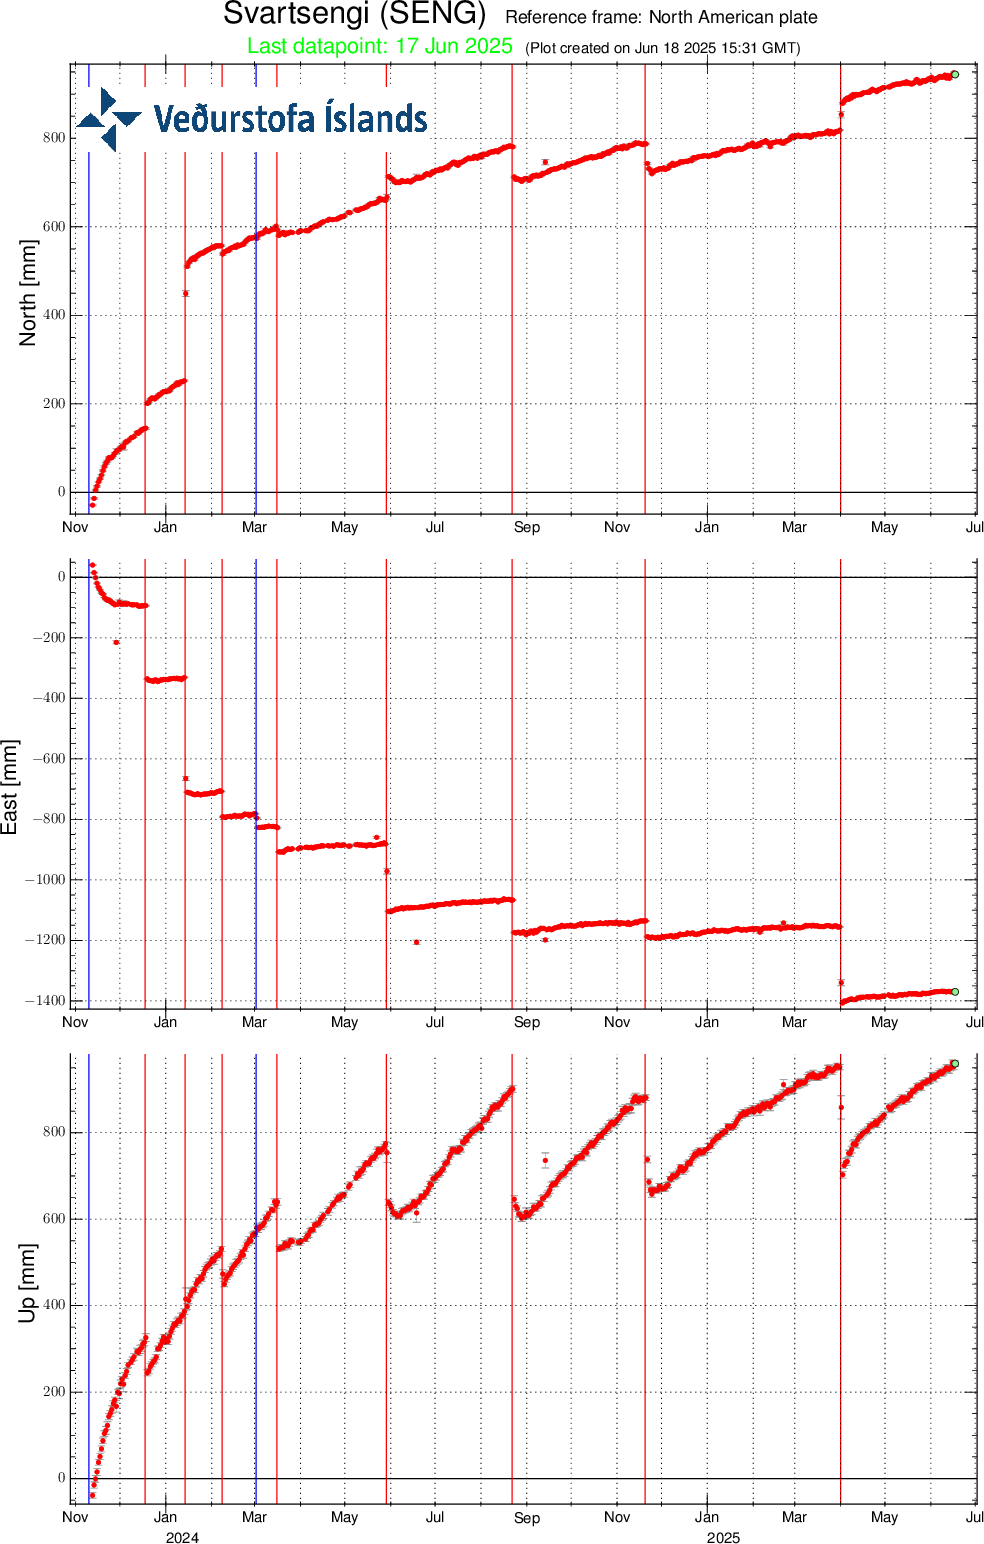
Image 2: GPS Measurments from Svartsengi (SENG)
The data shows deformation for north (top image), east (middle image), and vertical (bottom image) directions from November 2023 to June 17, 2025. Uplift (bottom image) continues but has slowed in recent weeks. Red lines mark key events such as magma intrusions and eruptions. The rate of uplift has decreased recently.
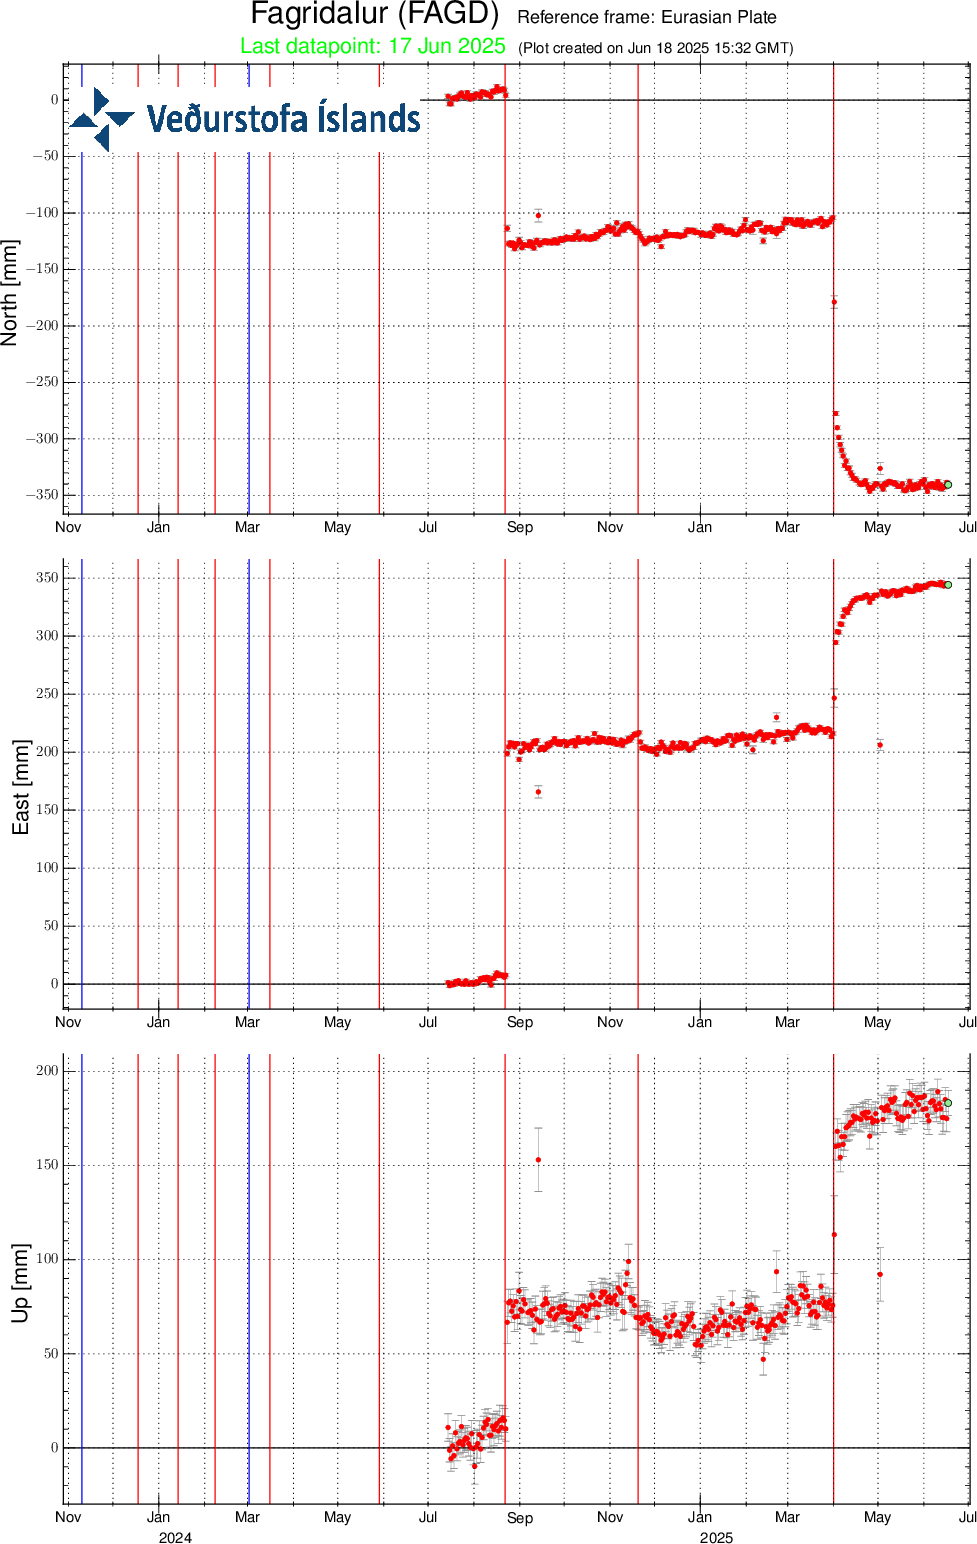
Image 3: GPS Measurements from Fagridalur (FAGD)
The data show movement/deformation at the GPS station FAGD, which is located west of Fagradalsfjall (GPS Fagridalur) Northward movement (top), eastward movement (middle), and the vertical movement (bottom). The station was established in the summer of 2024, so the data do not go further back. Blue lines represent intrusions without volcanic eruptions. Red lines indicate volcanic eruptions. The intrusion on April 1 occurred just west of this station, and the subsequent movements clearly show how the land shifts southeastward, away from and upward along the magma intrusion path.
Although the eruption on April 1, 2025, was the smallest in terms of lava flow at the Sundhnúkur crater row, the event was still extensive. The main part of the event consisted of a magma intrusion heading north, reaching farther north than Keilir. This intrusion was similar to the one on November 10, 2023, except that the November intrusion mainly moved southward and reached beneath Grindavík. Thus, the April 1 event was the second largest in the Sundhnúkur series, surpassed only by the November 10, 2023, intrusion.
Deformation Pattern During Magma Intrusions
Deformation measured during magma intrusions is characterized by a graben forming directly above the intrusion. The crust on either side of the dike moves outward and uplifts (see FAGD GPS station in image 3). At the same time, subsidence is measured in Svartsengi where magma exits the chamber and flows into the dike.
Deformation measurements near Svartsengi thus show both:
Subsidence due to magma flowing out from the chamber beneath Svartsengi
Uplift due to the formation of the magma dike
At the SENG GPS station (image 2), subsidence is visible but not as much as the magma outflow is causing due to the effects of the dike formation. When modeling magma accumulation under Svartsengi, one must adjust for the deformation caused by dike formation. Because of these effects, the uplift around Svartsengi has now reached the same level it was before April 1. However, only just over half the magma volume that exited the chamber has since been replenished (see image 1).
Earthquake activity
Seismic activity has remained relatively stable in recent weeks, with about 10 micro-earthquakes per day on average. Most of the earthquakes are located just north of Grindavík.
Hazard Map
The hazard map has been updated, and it will be valid until 15 July 2025. The map is almost unchanged from the previous one, but small editions may be worth noticing. 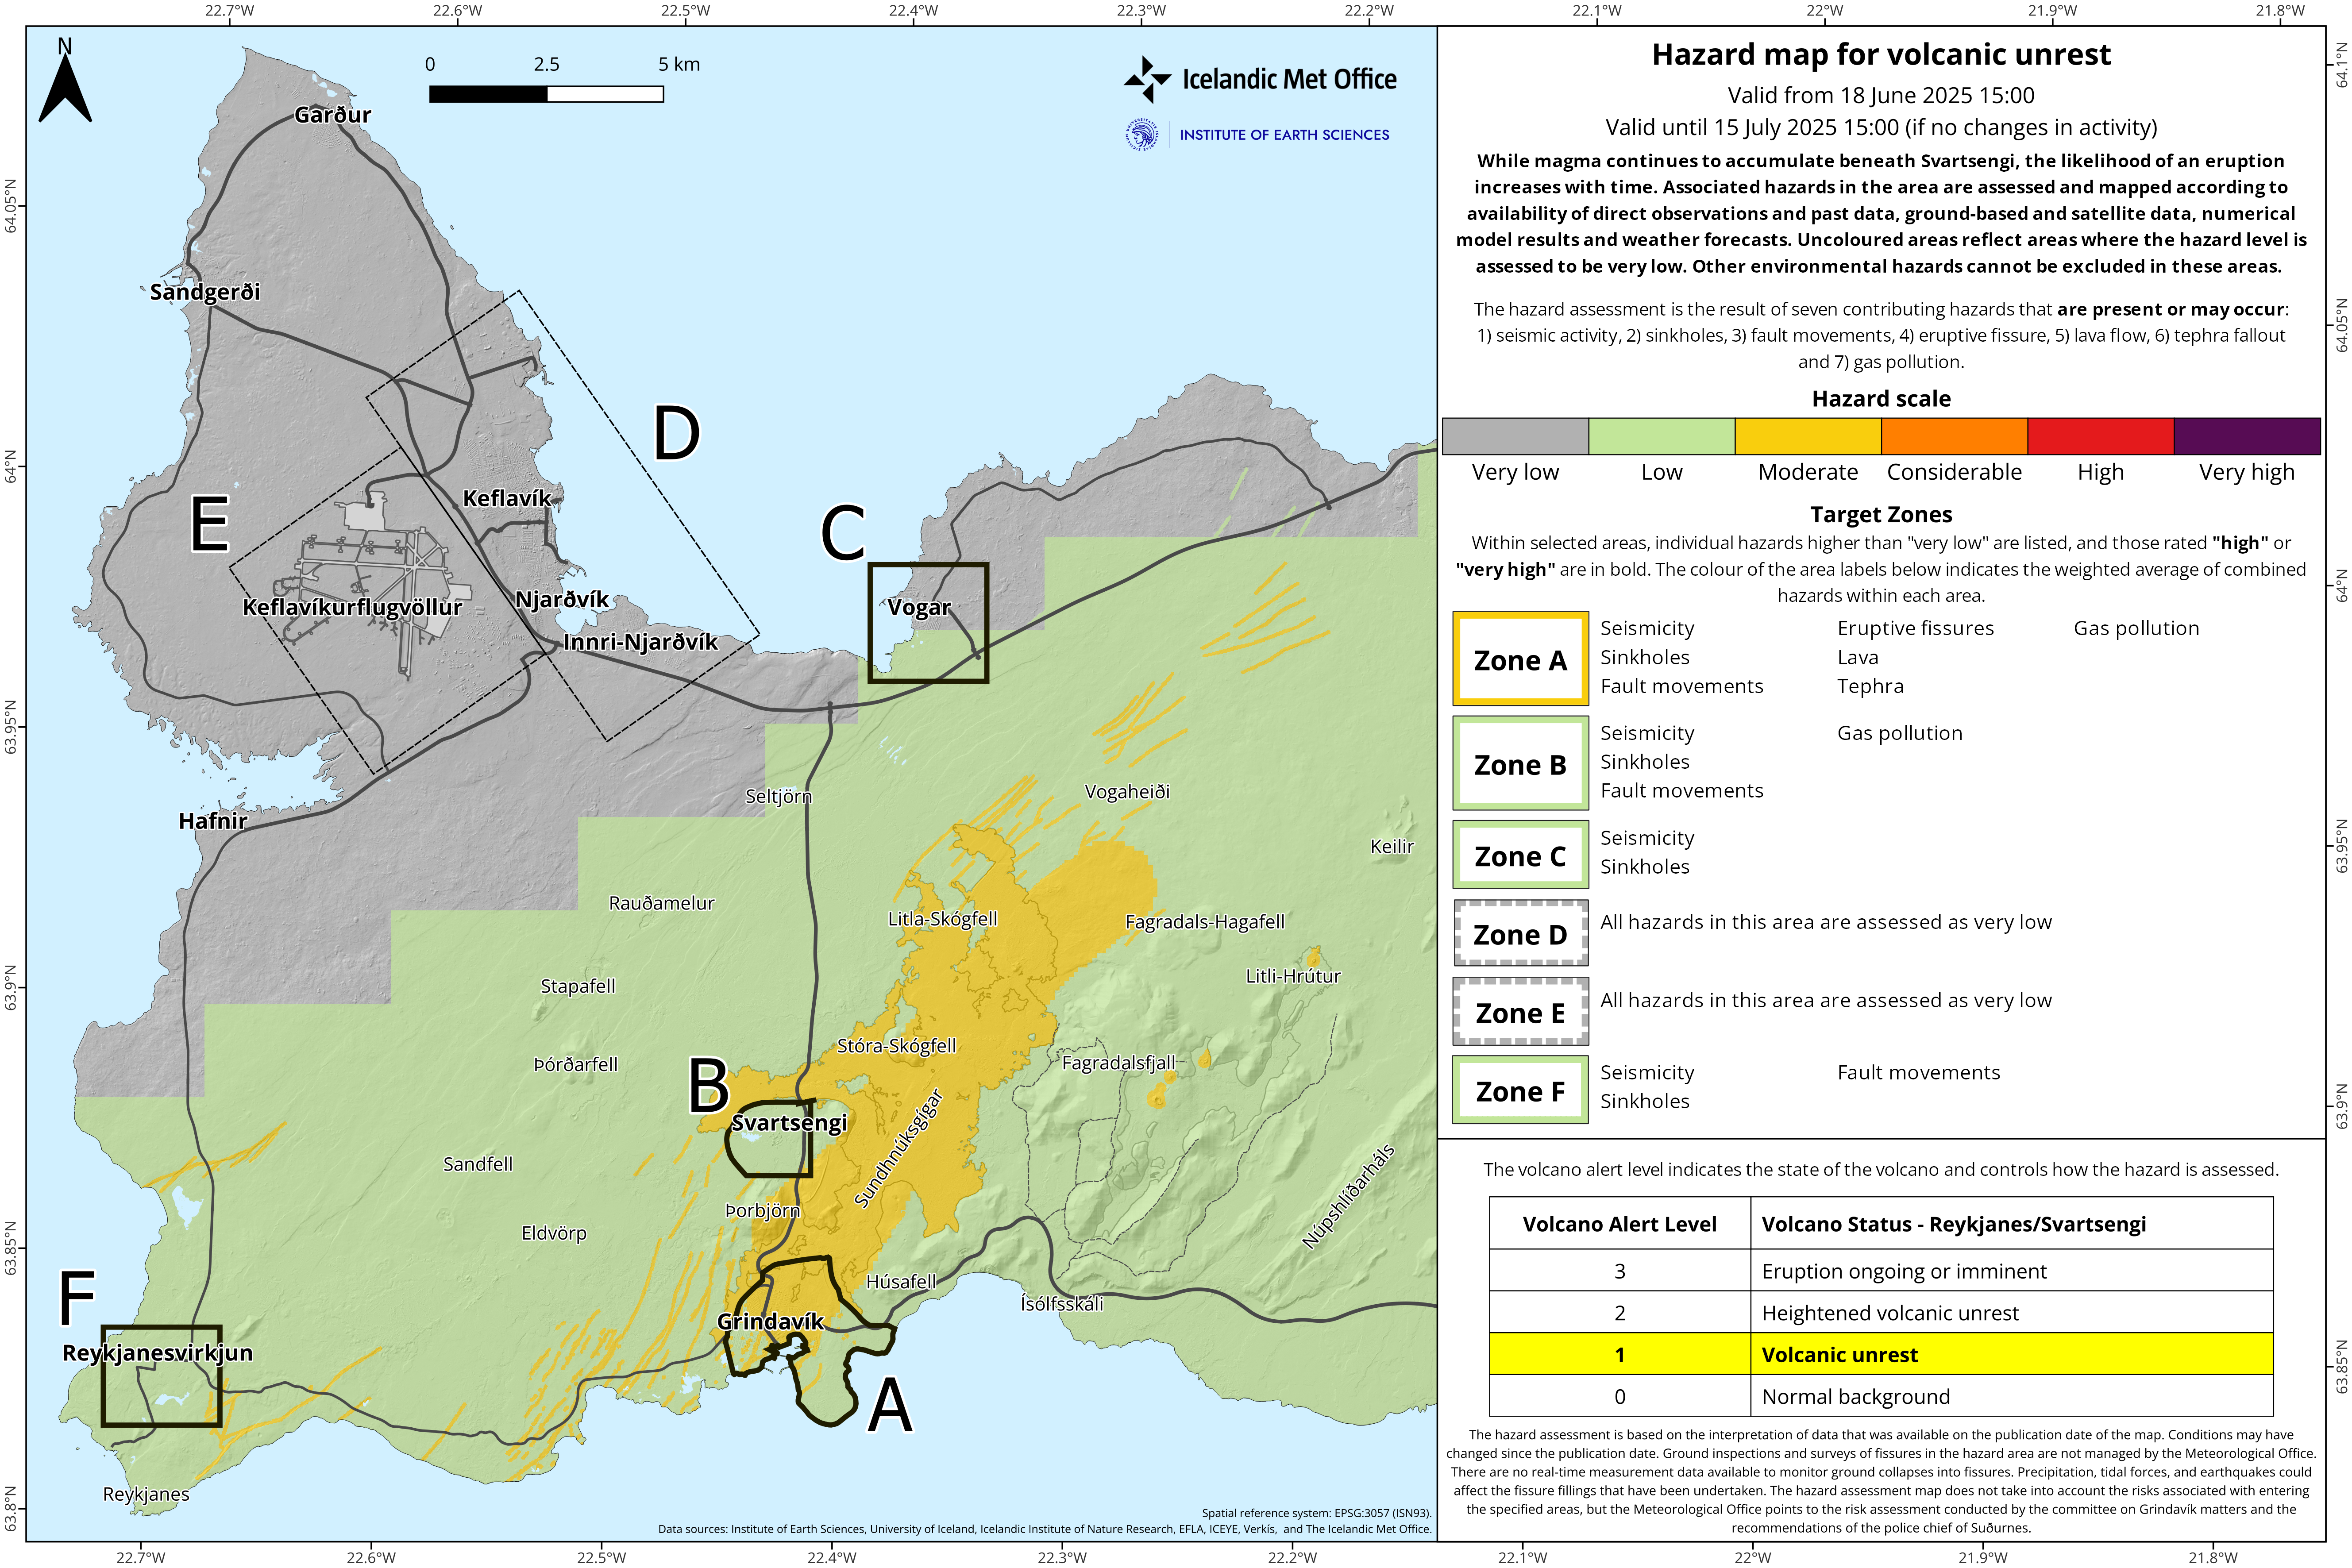
Image 4: IMO´s Hazard Map
The area between Vogaheiði and Fagradals-Hagafell is now assessed to be at low hazard, while it was marked to be at moderate hazard before. The change is due to a mistake while assigning the weight to the eruptive fissure hazard (which is now considered lower than before). The same applies to the Southwestern end of Zone A (Grindavík). Check for more information about the weight process here.
Hazard due to sinkholes is now listed as a potential hazard in Zone C (Vogar). This change is due to an oversight in checking the presence of fractures that occurred during the last event on 1 April. On that day the magmatic dike propagated much more to the northeast of Stóra-Skógafell, but minor fractures in southeast corner of this target zone were not initially spotted, as they became clearer after a double check.
The map reports on present hazards and those that may occur in the Svartsengi volcanic system.
- CategoriesEdited | Earthquakes | All Content | Government | Volcanos | Science | Europe | Atlantic Ocean | News | News -- WNT Selected | Text | Images
- Date rangeWednesday, June 18, 2025
- Last modifiedTuesday, August 05, 2025
